
Google search CTR benchmarks by position start with a 27.6% average for the first organic result in Backlinko’s published study; positions one through ten range from 27.6% to 2.4%. Use these figures as a historical baseline for 2026 planning, not as measured 2026 performance or a guaranteed result for your website.
- Backlinko’s google search ctr benchmarks by position put the first organic result at 27.6% CTR.
- The published top-ten organic CTR range is 2.4% to 27.6%; these are historical benchmarks, not 2026 measurements.
- Google Search Console comparisons need matching devices, query intent, countries, and search appearance.
- Tsehay Restaurant & Bar’s local dining searches need separate analysis from broad informational searches.
Why this matters
Ranking tells you where a result appeared. Click-through rate tells you how often an impression became a website visit. Neither metric, by itself, tells you whether that visit produced a customer.
For Tsehay Restaurant & Bar, an Ethiopian restaurant in Adams Morgan, Washington DC, searches for the restaurant’s name and searches for Ethiopian dining represent different intentions. Treating both groups as one benchmark hides that distinction.
Use position benchmarks to investigate performance, not to declare a page successful or unsuccessful. The useful question is whether a page earns clicks from the people its content is meant to help.
Organic Google CTR benchmarks by ranking position
Organic click-through rate is organic search clicks divided by organic search impressions, expressed as a percentage. Backlinko’s published position-level averages provide the following reference curve for the first ten organic results.
| Organic ranking position | Average organic CTR | How to read the benchmark |
|---|---|---|
| Overall, across all positions | No pooled benchmark stated here | Use the position-specific rows instead |
| First | 27.6% | Highest click-through rate in the published curve |
| Second | 15.8% | Below first place, above every lower position |
| Third | 11.0% | Lowest position with a double-digit average |
| Fourth | 8.4% | Below the leading three results |
| Fifth | 6.3% | Middle of the reported top-ten curve |
| Sixth | 4.9% | Below five percent in this dataset |
| Seventh | 3.9% | Lower first-page reference point |
| Eighth | 3.3% | Below seventh place |
| Ninth | 2.7% | Above only tenth place in this table |
| Tenth | 2.4% | Lowest click-through rate in the reported curve |
First position leads at 27.6%; tenth position trails at 2.4%. The gap between first and second is 11.8 percentage points, compared with 0.3 percentage points between ninth and tenth.
Methodology: Source: Backlinko’s Google organic CTR study, published in 2022, based on an analysis of four million Google search results. These are the study’s aggregate position-level averages, not a restaurant-specific sample or a measurement of 2026 search layouts.
The named limitation is aggregation: this curve does not isolate your query intent, device, location, or result-page features. It cannot tell you what one restaurant page should earn from one local search.
What the high and low numbers actually mean
The first result’s 27.6% CTR describes an average in the source dataset. It does not mean every first-place result receives that share, and it does not establish a minimum acceptable performance level.
Likewise, tenth position’s 2.4% is not a traffic ceiling. A particular query can perform differently because the audience, competing results, and displayed search features differ from the study’s combined sample.
Do not add the rows and interpret the result as a complete allocation of one searcher’s attention. Position-level averages are not a single tracked journey through one results page, and users can click more than one result.
Why there is no single overall target
An overall CTR combines the visibility a website receives across positions and queries. A website appearing mainly near the top and another appearing mainly near the bottom do not have comparable exposure.
That makes a universal sitewide target misleading. For your 2026 reporting, a position-matched comparison is more useful than an unqualified average across the entire website.
How to use these benchmarks
Compare similar search exposure
Start with the position-specific row, then narrow your own reporting to comparable searches. A first-position page belongs beside the 27.6% reference, not beside the tenth-position 2.4% reference.
Keep the comparison honest: matching position is only the beginning. Separate mobile from desktop, branded from nonbranded searches, and the countries that matter to your business.
Prioritize meaningful gaps near the top
The published first-to-second gap is 11.8 percentage points. That makes strong visibility near the top worth investigating, but it does not prove that a title change or ranking improvement will produce the same gain on your website.
Review relevance before rewriting a result. If the query asks a question the page does not answer, a more forceful headline does not fix the underlying mismatch.
Diagnose low CTR before changing content
The tenth-position reference is 2.4%, while fourth position averages 8.4%. A low CTR can reflect lower visibility rather than a weak page title.
Check position changes alongside clicks and impressions. If rankings fell, separate that problem from a snippet problem before deciding what to edit.
Judge traffic alongside business outcomes
The 27.6% first-position average measures clicks, not reservations, calls, directions, or completed visits. A search visit is one step, not the final outcome.
For 2026 decisions, connect organic traffic to the actions your business actually measures. Do not attach a commercial success claim to a CTR change alone.
Build a fair comparison in Google Search Console
Google Search Console reports clicks, impressions, CTR, and average position for your own search performance. Use its filters to construct a comparison that keeps the audience and reporting conditions consistent.
Follow this sequence before deciding that a page underperforms:
- Search type: Use Web search when comparing with an organic web-result benchmark.
- Date range: Keep reporting windows consistent, and account for seasonal differences when interpreting changes.
- Query intent: Separate branded searches from category searches and informational questions.
- Device: Review mobile and desktop separately rather than relying only on the combined total.
- Page review: Inspect the landing page and its queries together before proposing an edit.
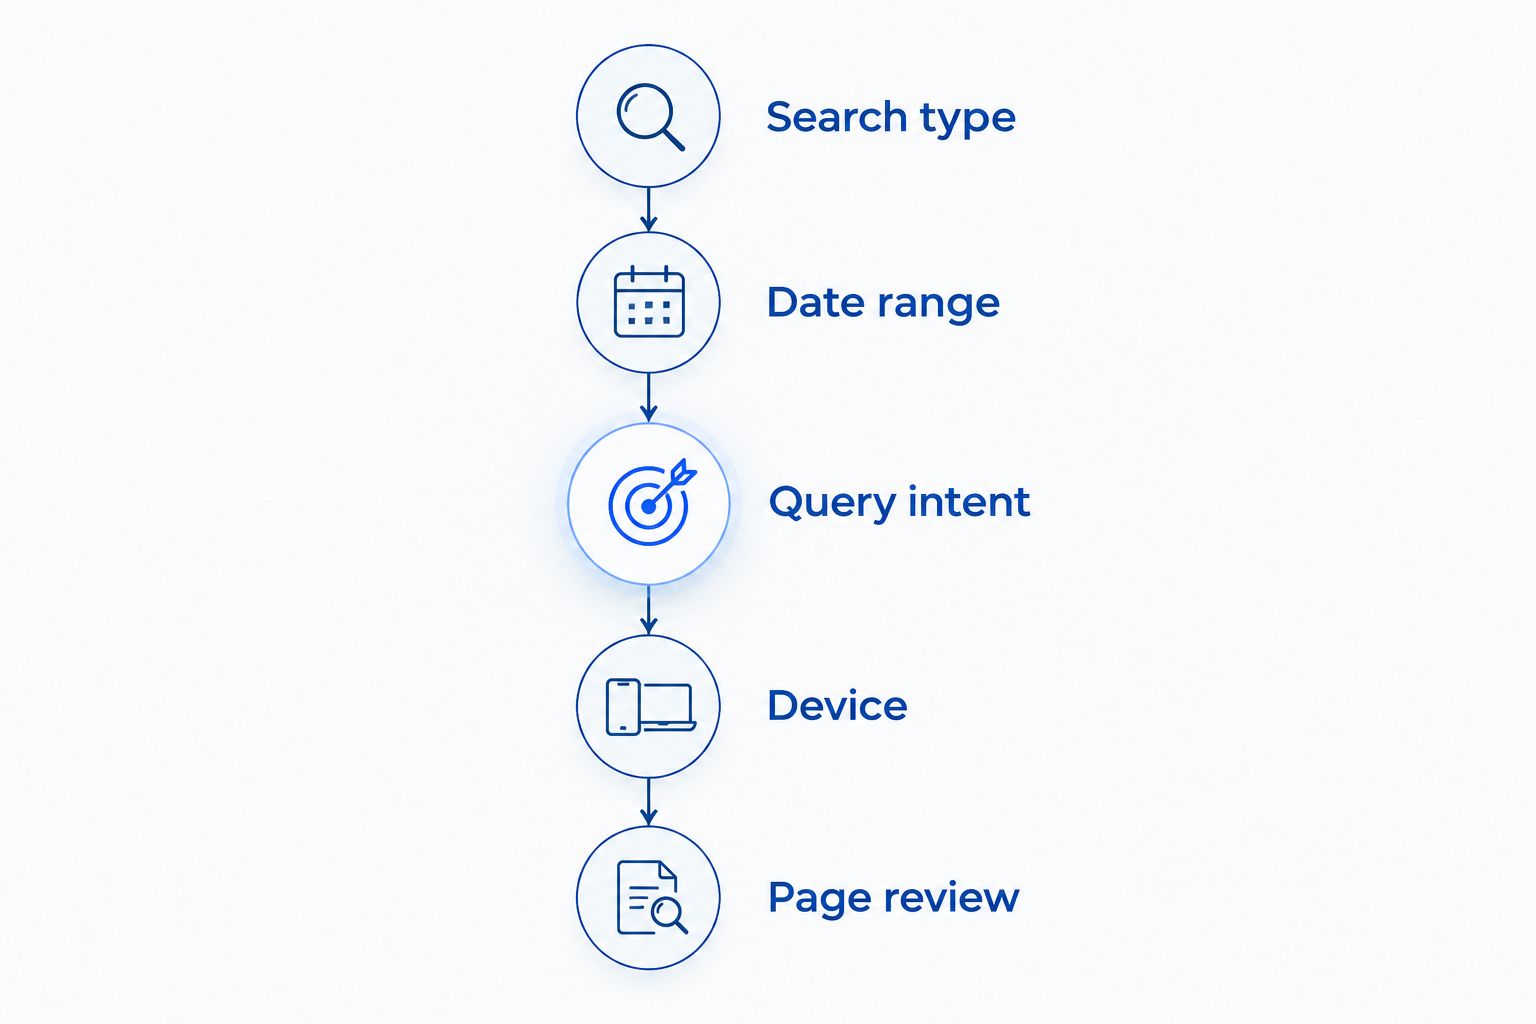
This process gives you a defined comparison group. Record the filters with your conclusion so the next person reading the report knows exactly which searches the result describes.
Calculate combined CTR correctly
Calculate a group’s CTR by dividing its total clicks by its total impressions. Do not take an unweighted average of the individual CTR percentages shown in separate rows.
A query with many impressions should contribute more to the combined rate than a query with very few. Averaging the percentages treats those unequal audiences as though they were equal.
Keep that distinction in mind when exporting data. A spreadsheet can produce a mathematically valid average that answers the wrong business question.
Keep average position in context
Search Console’s average position summarizes positions across impressions. It does not mean your result occupied one fixed place for every searcher throughout the reporting period.
A page with changing rankings therefore does not match a single benchmark row perfectly. Inspect the underlying queries and reporting periods before labeling the difference a content problem.
For 2026 reporting, describe the comparison as a directional reference. Do not present an average-position match as a controlled experiment.
Apply the curve to local restaurant searches
Tsehay Restaurant & Bar serves diners seeking traditional Ethiopian cuisine in Adams Morgan, Washington DC. Its restaurant search analysis should distinguish people looking for the business itself from people exploring where or what to eat.
Those groups ask different questions. The right landing-page answer changes with the question, even when the average ranking position looks similar.
Restaurant-name searches
A restaurant-name query identifies a specific business. Review these searches separately so they do not obscure performance on broader dining queries.
Check whether the search result accurately identifies the restaurant and location. Do not infer a reservation policy, opening schedule, or dining feature from a benchmark report.
Category and neighborhood searches
Queries about Ethiopian dining or restaurants in Adams Morgan involve a different choice than a direct restaurant-name search. Examine which page appears and whether it answers the searcher’s actual question.
For Tsehay Restaurant & Bar’s Ethiopian restaurant searches, compare like intent before comparing CTR. A category guide and a restaurant homepage have different jobs; the benchmark cannot decide which page belongs in the result.
Informational dining searches
Questions about Ethiopian food are not identical to searches for a place to eat tonight. An informational page should answer its question directly rather than force an immediate restaurant pitch.
Evaluate the page against similar informational queries. A change in the mix of questions receiving impressions can change aggregate CTR without establishing that the page became better or worse.
What to change when CTR falls short
Start with the page’s job, not a promise of higher clicks. The benchmark shows a relationship between position and CTR; it does not identify which edit will improve your result.
- Check the query match. Make sure the page answers the query attracting impressions. If it does not, address the content mismatch before changing the title.
- Check the title’s accuracy. Name the subject clearly and remove claims the page does not support. Keep the location when location is central to the search.
- Check the opening answer. Put the useful response near the beginning so readers can confirm they reached the right page.
- Check the visible result. Review what Google actually displays rather than assuming your preferred title and description always appear unchanged.
- Check the outcome. Compare clicks with the relevant measured business action before calling an edit a success.
Make a focused change and record when it happened. Avoid rewriting the title, changing the page purpose, and replacing the main content together if you want to understand which intervention mattered.
Keep an honest change log
A practical change log records the page, the intended query group, the edit, and the comparison period. Add the device and country filters used in the evaluation.
Record competing explanations too. A ranking shift, a different query mix, or a change in search presentation can complicate the interpretation of a CTR increase.
For a 2026 review, preserve the benchmark’s historical label alongside the current reporting period. That prevents an old reference curve from quietly becoming a claimed current-year study.
FAQ
What are Google search CTR benchmarks by position?
Backlinko’s published organic CTR averages are 27.6% for first position, 15.8% for second, and 11.0% for third. Its 2022 study analyzed four million Google search results; use the figures as historical reference points, not measured 2026 averages.
What is a good Google organic click-through rate?
A useful CTR target matches your ranking position, query intent, device, and audience. The published 27.6% first-position average is not an appropriate universal target for every page or website.
Are these benchmarks new data collected in 2026?
No, these figures come from Backlinko’s published 2022 study. Their role in 2026 is to provide a labeled historical baseline, not to describe a newly measured search environment.
Does average position in Search Console mean a fixed ranking?
No, average position summarizes positions across impressions. Your result can appear in different places for different searches, so compare the underlying queries and reporting conditions before diagnosing a CTR problem.
Should a restaurant compare branded and nonbranded search CTR together?
Analyze branded and nonbranded searches separately before combining them. Searches naming a restaurant and searches exploring a dining category represent different intentions and should not share an unqualified target.
Does a higher CTR prove that a restaurant gets more customers?
No, a higher CTR proves only that a larger share of counted impressions produced clicks. Connect search traffic to the business actions you measure before making a customer-growth claim.
How do I calculate CTR across several queries?
Divide the queries’ combined clicks by their combined impressions and express the result as a percentage. Do not use a simple average of the individual query percentages, because their impression totals differ.
One last thing
Your CTR can fall while your search reach expands. If a page starts appearing for additional queries at lower positions, those impressions can reduce its combined rate without proving that its established queries lost appeal.
Before rewriting a page, separate existing queries from newly visible ones. Then inspect clicks, impressions, position, and business outcomes together; a percentage alone cannot describe the full result.
Related guides
- Best Ethiopian food in DC
- Is injera supposed to taste sour?
- Is Ethiopian food meant to be eaten communally?